
Let your P&L talk.
Every number, traced to the operation that moved it.
| Line | Plan | Actual | Δ |
|---|---|---|---|
| Revenue | 46.90 | 48.20 | +1.30 |
| Cost of goods sold | 30.72 | 33.07 | +2.35 |
| Gross profit | 16.18 | 15.13 | −1.05 |
| Gross margin | 34.5% | 31.4% | −3.10 pts |
| Operating expenses | 9.40 | 9.55 | +0.15 |
| EBITDA | 6.78 | 5.58 | −1.20 |
Ask your business anything.
Opti explains what changed, why, and what to do next, with the evidence.
Change the plan. Watch the budget answer.
One margin. Four operations behind it.
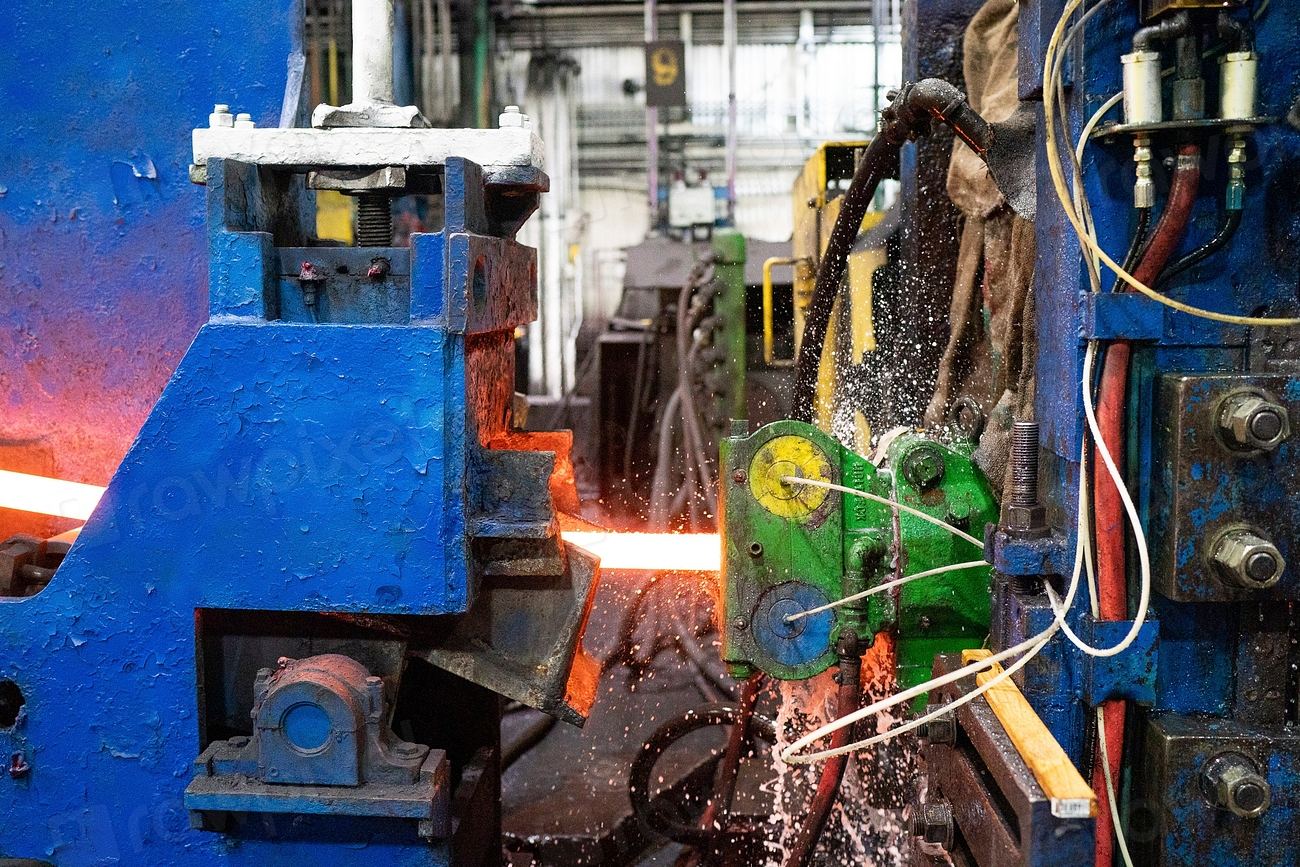


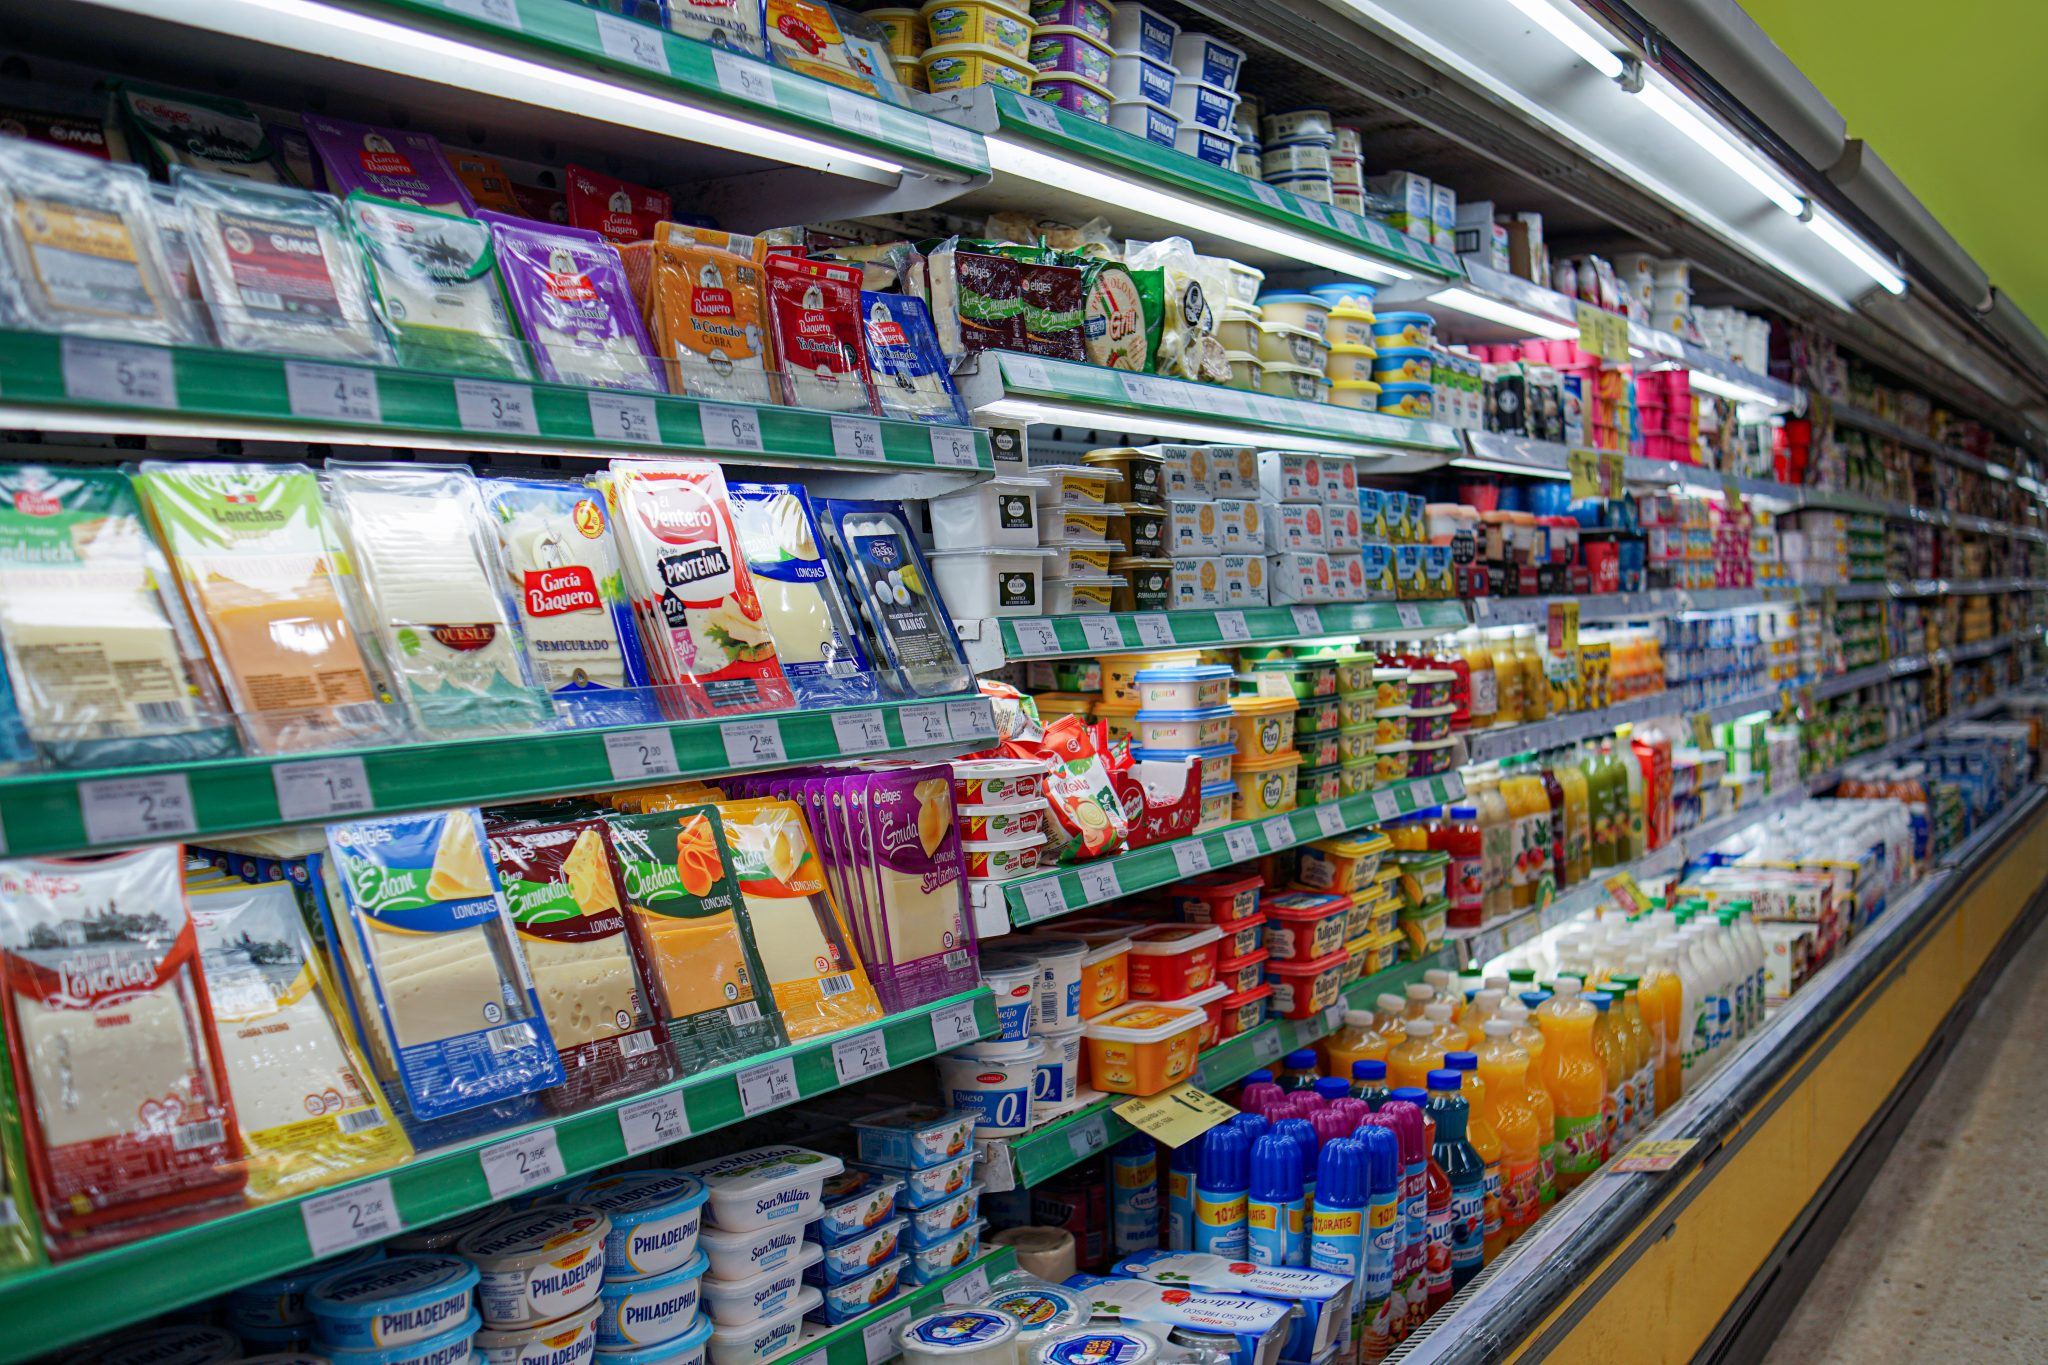
Every number has an operational story.
Change a driver. See the consequence.
*Cash assumes 45 days of working capital on the revenue change. Profit ≠ cash.
One plan. Every world.
Scenario inputs, not forecasts. Middle option = budget base. Effects = % vs base, computed from:
- 1.0M bbl per quarter
- 12.5% royalty
- $22/bbl lifting cost
- $15/bbl sustaining capex
Start with your P&L. Go deeper into your operations.
- ◆Overtime
- ◆Re-sequence lines
- ◆Second supplier
Already know the operational decision? Go straight to your sector play. No OptiPlan required.
Seeing is believing.
Target: two weeks, counted from the day scope is agreed and data and access are ready.
One material variance traced to its operational drivers and source records.
A driver-based forecast that shows emerging risks to P&L and cash.
A decision scenario: alternative actions within operating constraints.
Evidence behind the answer. Ownership behind the action.
Bring your hardest P&L question.
One business unit. One question. Scope, success criteria and commercial terms agreed upfront.